Hello,
I am creating Charts using phantomjs + Charts and want to integrate them to my PDF file.
In the attached file Original.png you can find the original image I am loading into the pdf.
Attachment:
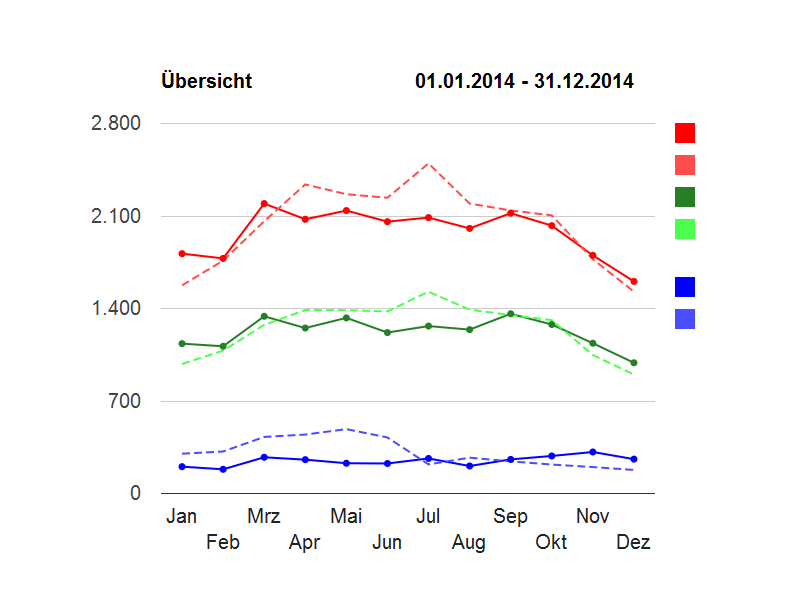 Original.png [ 33.63 KiB | Viewed 10429 times ]
In the attached file PDF.png you can find a screenshot of how the image looks in the pdf.
Attachment:
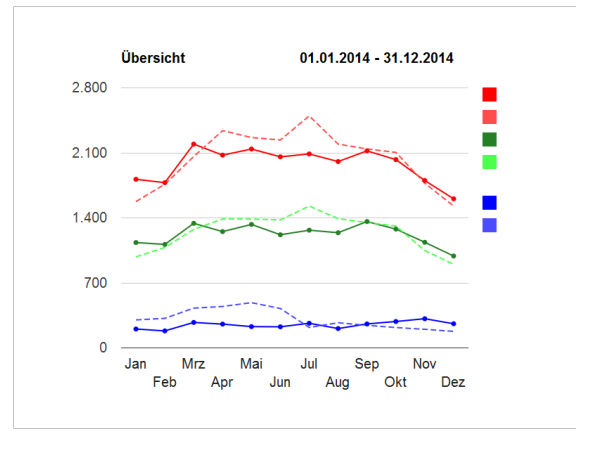 PDF.PNG [ 39.33 KiB | Viewed 10429 times ]
The Code for integrating the image is as follows:
Code:
var image = new Image(vsChartImage);
image.Width = Unit.FromCentimeter(15);
Table table = document.LastSection.AddTable();
table.Borders.Visible = false;
Column col = table.AddColumn();
col.Format.Alignment = ParagraphAlignment.Left;
col.Width = Unit.FromCentimeter(16);
col = table.AddColumn();
col.Format.Alignment = ParagraphAlignment.Right;
col.Width = Unit.FromCentimeter(8);
Row row = table.AddRow();
row.Cells[0].Add(image);
Here vsChartImage is the path of the Image.
How can I remove the borders drawn around the image?


